Bringing real-time data to life
Hopara is the MIT-developed real-time analytics solution that empowers any end user to easily make better, data-driven decisions through a unique combination of limitless, live data; custom canvasses; real-time actionable insights, and the power to access and understand comprehensive data stores in context.
Are you drowning in data but no better informed? Some of the main challenges with today’s analytics solutions and data dashboards are: People can’t get dynamic data fast enough Whether it’s stock data or traffic delays, milliseconds can spell the difference between success and failure. The majority of today’s solutions can only provide after-the-fact reporting. People can’t freely navigate to see data in context Spreadsheets, graphs, and charts are abstract representations. When users can associate real-time data with relevant visual touchpoints (think maps, schematics, AR graphics) it is much easier to make novel and important data-driven connections. Data isn’t being presented in the way human minds are proven to make connections and gain insight We are constantly learning more about how the brain work in “discovery mode.” Tomorrow’s tools must leverage these proven principles to marry big-data potential to human-scale decision-making.
"Tomorrow’s advantage will go to those who most quickly (and easily) convert data-collection into business insights. Hopara's next-gen data viz and humanized approach to navigation gives data stewards and stakeholders a leg up." /mike
Who is Mike?
MIT Professor 2014 Turing Awardee Inventor of Postgres Founder of Hopara…
Next gen data viz minimum requirements include:
Pan & Zoom
Hopara’s proprietary Data Drone Navigation supports semantic zoom allows changing the representation of the data as the user zooms in and out, increasing or decreasing details to give the most meaningful presentation at each zoom level.
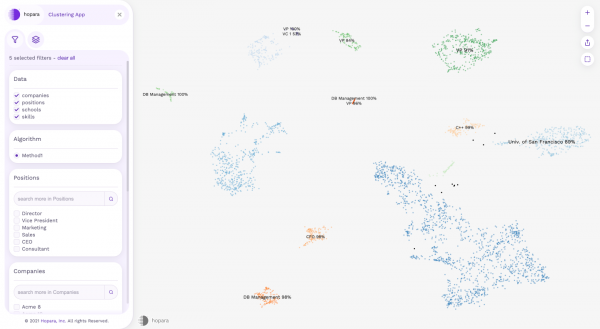
Detail on Demand
Find the areas of detail in your data and drill into them for greater focus to find actionable insights 385% faster using Hopara than traditional tools.
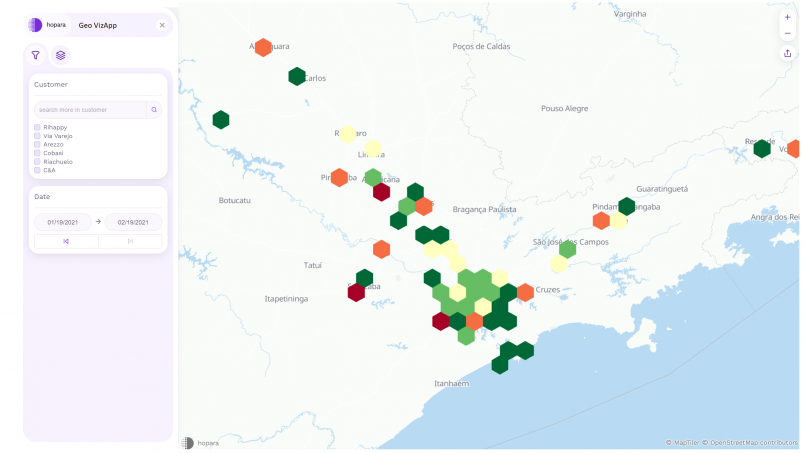
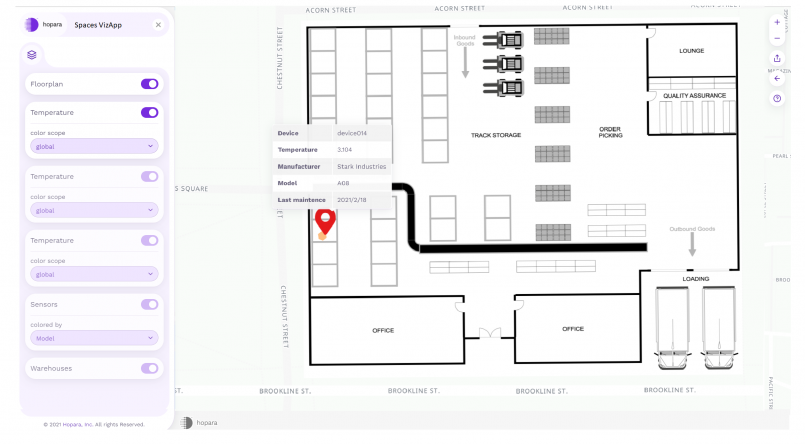
Custom Canvases
Plot data on a custom canvas such as floor plans (with multiple floors) or customized map using spatial indexing to view the precise locations where data is being tracked.
Hopara delivers:
Next Gen Data Viz
Real time pan and zoom data visualization that lets you see and understand ever changing relationships and discover actionable insights.
with a DIY App Builder...
Select from a suite of pre-configured data apps to create your own compelling visualizations, without costly customization or the ongoing expense of teams of specially trained staff.
that takes you beyond two dimensional dashboards...
While BI and reporting dashboards give you collections of summary statistics, Hopara lets you navigate through you data sets, draw conclusions and explain the unexpected to go beyond “what” to “why”
helping users find actionable insights on their own.
If a viewer can use a mouse, they/he/she can engage with a Hopara App from moment one reducing barriers to adoption.
Trusted by T-Group, CDO, Agero, Meds, Sens2b, AI, SVB, Elemental Machines
Seeing Is Believing
Hopara can add next-gen visualization to IoT/Machine sensor, logistics, cyber security or data warehouse.